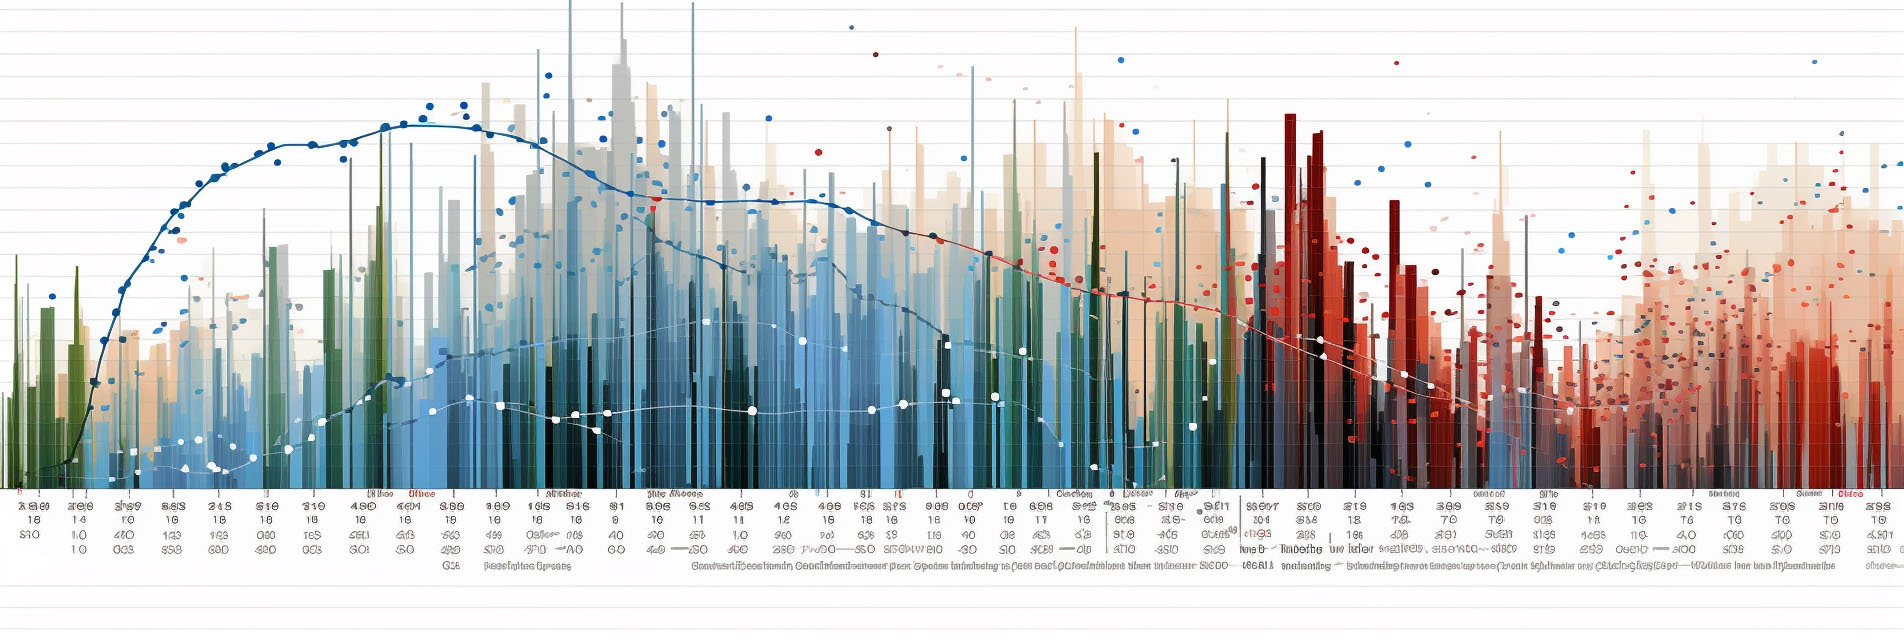
Time series analysis

Time series analysis is a statistical technique used to analyze time-ordered data points. These data points are typically collected or recorded at a constant time interval, such as daily stock prices, monthly sales data, or yearly climate measurements. The primary goal of time series analysis is to identify patterns, trends, and other characteristics in the data over time, and to use this information for forecasting future values, understanding underlying mechanisms, or making informed decisions.
There are various methods and approaches for conducting time series analysis, depending on the nature of the data and the questions being asked. One of the most basic forms of time series analysis is descriptive statistics, where measures like mean, median, and standard deviation are calculated to summarize the data. Graphical representations, such as line charts or scatter plots, are also commonly used to visualize trends and patterns.
More advanced techniques include autocorrelation analysis, which examines the relationship between a variable and its past values to identify recurring patterns. Seasonal decomposition methods can be used to separate the time series into different components like trend, seasonality, and noise. Statistical models like ARIMA (AutoRegressive Integrated Moving Average) and its variants are often employed for forecasting future values based on past observations.
In the realm of machine learning, techniques like neural networks and support vector machines are increasingly being applied to time series forecasting. These methods can capture complex relationships and patterns in the data but often require large datasets and significant computational power.
Time series analysis is widely used in various fields for different purposes. In finance, it's used to forecast stock prices and economic indicators. In marketing, it helps in understanding sales trends and predicting future demand. In healthcare, time series data like heart rate or blood pressure readings can be analyzed to monitor patient conditions. In environmental science, it's used to track changes in climate variables over time.
However, time series analysis comes with its own set of challenges. Data may contain outliers or missing values that need to be addressed. The presence of noise can make it difficult to identify true patterns or trends. Also, many traditional time series methods assume stationarity, meaning that the statistical properties of the series do not change over time, an assumption that is not always valid.
In summary, time series analysis is a versatile and widely-used method for analyzing data points collected over time. It employs a range of techniques, from basic descriptive statistics to advanced machine learning models, to identify patterns, make forecasts, and derive insights. While it offers valuable information in various domains, it also presents challenges that require careful data preprocessing and method selection.